Modelling Exponential Data in Google Sheets
Exponential Data has uses even if they rarely exist in the real world as they allow you to communicate more easily. Even though it may not seem like it, Google Sheets does allow you to model exponential data without installing plugins or graphing.
Published on 2023-09-27 | 4m 38s
Linear models are pretty great. They are so common that people use them for things they shouldn’t be used for. I’ve seen people slap a linear model for no reason even if doesn’t make sense for the data being used.

One of them is to model exponential data. While true exponential data probably doesn't exist in the real world, it is still hard to model it as the more realistic logistic model for a few reasons. The biggest one is that they are simpler and easier to understand. Most people don't know what a logistic model is and they will get more confused by the equation if you show it to them:
So yeah - exponential models are here to stay. So make sure you know how to model them. The good thing is that it is easy to do in Google Sheets even if it doesn't look like it has the in-built functionality for it.
Linear Modelling in Google Sheets
The way to do exponential modeling and even logistic modeling in Google Sheets is more of a mathematical hack on linear models. Thus, understanding how to do linear models is a prerequisite to it.
Fortunately, it is very simple to do so in Google Sheets: FORECAST or FORECAST.LINEAR (they are both the same). For reference, the formula for a Linear Model is as follows:
FORECAST calculates the expected y-value based on a best fit line for the given x and y values - but it doesn't give the equation itself which is incredibly useful for communicating to stakeholders. To get the values of a and b, we need to use the formulas SLOPE and INTERCEPT respectively.
Let's try using data with the formula y = 2x combined with some error. Sample data is shown below and the full data can be found on this Google Sheet (If you want to reproduce it, please duplicate the GSheet).
| x | y |
|---|---|
| 1 | 1.08 |
| 2 | 4.27 |
| 3 | 6.00 |
| 4 | 7.68 |
| 5 | 9.32 |
To find the slope and intercept, we use the formula =SLOPE(B2:B31, A2:A31) AND =INTERCEPT(B2:B31, A2:A31). This gives us a final formula of:
When you use the formula above, you should have the same results when you use FORECAST. The main advantage to getting the slope and intercept is the ability to communicate to stakeholders and intuition on where it is heading.
There are definitely more values we need to consider - like the R^2 for one. But this should give you a good overview on the next steps.
Modeling Exponential Data in Google Sheets
Now, while linear regression is useful, it can also be very limiting since not everything is linear in nature. This is a problem I had before: Revenue was growing fast so it was unreasonable for me to use linear regression for prediction since the discrepancy would be so big eventually that it won't be reliable. But I also wanted to use a tool that was easy to understand and explain - which is usually Excel or Google Sheets.
So I did what I did: Use the power of logarithms for predicting exponential models. For reference, exponential models have the following equation:
Now, I'm not going to tell you the math but that equation is equivalent to this:
You will notice how similar it is to the linear equation:
Thus, modeling exponential data and finding the constants just requires a bit of preprocessing and postprocessing. In the same Google Sheet as earlier, you will find a sheet containing sample exponential data as shown below. It is of the equation y = 2 * 1.5^x combined with some error.
| x | y |
|---|---|
| 1 | 2.10 |
| 2 | 2.31 |
| 3 | 2.27 |
| 4 | 2.33 |
| 5 | 2.63 |
Before doing anything, we must get the logarithm first of y. This is simply done by doing =LN(B2:B31). This will show the following sample results:
| x | y | LN(y) |
|---|---|---|
| 1 | 2.10 | 0.742 |
| 2 | 2.31 | 0.835 |
| 3 | 2.27 | 0.818 |
| 4 | 2.33 | 0.846 |
| 5 | 2.63 | 0.968 |
Now we can use slope and intercept as normal but using LN(y) instead of y. In other words: =SLOPE(C2:C31, A2:A31) and =INTERCEPT(C2:C31, A2:A31). These two yield a value of 0.049 and 0.69. Our formula is therefore equivalent to the the equation below.
To turn this into the general equation of an exponential function, we need only do some mathematical tricks. I will not bore you into the details (you can read up on logarithms and exponents should you want to do so) but the process is simply getting the Euler's number exponent of the slope and intercept.
=EXP(SLOPE(C2:C31, A2:A31))
=EXP(INTERCEPT(C2:C31, A2:A31))
These two yield values of 1.050 and 1.994 which can be combined to the formula:
This equation is now much easier to communicate. You can say to stakeholders now: We are growing 5% every x interval (If your x is by month, it grows by 5% each month). If percent growth is high but the absolute numbers are still low, you can communicate: We have high growth but because we started with 1.994 items, our absolute numbers are still low.
An Even Shorter Hack
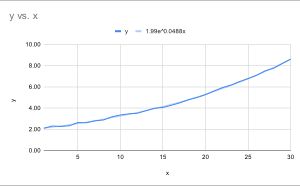
If you want an even shorter hack, you can always graph the model. You can find the equation by going into "Customize" -> "Series" -> "Trendline" and then pick "Exponential". Use "Use Equation" as the label to find the equation of the trendline in the label.

The equation above is the same as what we found. What makes this solution better is that you can find polynomial, logarithmic, and power series trendlines as well as their equations. The main advantage in not graphing is mostly preference.